Affichage des articles dont le libellé est Projects. Afficher tous les articles
Affichage des articles dont le libellé est Projects. Afficher tous les articles
Devices like a serial printer, barcode scanners, scale, GPS, surveillance cameras, serial consumer/ industrial devices all have one thing in common and that is they all use RS232, RS485 or RS422 serial cable connection to interact with a computer. Having remote access to this kind of devices from a remote computer is a headache that I plan to show you how you can get rid of.
To access these devices via Ethernet or LAN or convert Serial Port to IP, we can use two solutions viz: Serial to Ethernet Converter (Software) and any Hardware with COM port to Ethernet converting capability.
Let's start with the software solution, as I already mentioned it is called Serial to Ethernet Converter and was developed by Eltima.
Serial Port to Ethernet converter (Software)

Description of Serial to Ethernet converter: Serial to Ethernet Converter facilitates access to any serial port device connected to a local computer/device from any remote location and the remote computer will treat this device as if it was physically connected to its serial port. Here there is no need for installation of additional software. You can share more than 500 serial port devices over TCP/IP network without any restriction. These created ports can also be accessed simultaneously.
How to use Serial to Ethernet converter: You start with the installation of the software on all the computers that will use the serial device. By doing this, the serial device will be made available over the Ethernet to you and every other person who is going to use the serial device.
Serial to Ethernet Converter enables conversion of COM port data to Ethernet. These converted data can in turn be shared and accessed over network. Here the remote computer will display a virtual serial connection that helps the software communicate with the port.
A noteworthy feature of Serial to network converter is that it runs as a Windows service. This guarantees that every single connection is automatically reconfigured on system reboot. This is a feature I found interesting because you don’t need to keep the interface constantly open, it will be running in the background. The other fantastic thing about Serial to Ethernet Converter is the ability to transfer a configuration to another computer in form of backup.
It is available for Windows and Linux platform. It is also interesting that you have the flexibility to decide which platform will be the server and which will be the client. However, the Linux version available now is a command-line solution. It can as well broadcast over UDP too.
Hardware Solutions that can convert serial port to Ethernet:

Description: This is a small electronic device capable of converting either RS232, RS485 or RS422 serial data signals to Ethernet IP/TCP packets and vice versa. In other words serial to Network converter. The downsides of this type of devices include available port limitation. It can be 1 or 20 ports for instance and you can’t alter the numbers because they are fixed. Serial to Ethernet Converter is fairly easy to use and set up, although it’s an edge to have an idea of the computers and network settings.
How it works: All converters have an inbuilt circuitry capable of converting serial data to IP/TCP packets and back. It can convert to any direction.
Setup guide: The hardware comes with a driver (alias virtual COM software) that needs to be installed first into your computer. Once the installation is complete, the virtual COM software will now be able to create a virtual COM port in your computer's Device Manager when the hardware is connected to your computer.
At this point, you can now connect the hardware to your computer using the standard cable which is normally included in the hardware box. Next step is to connect your converter to a power supply, enter the IP of the hardware into your browser address bar and click enter. Now you can set up the converter by assigning a static IP to your own computer. This is important for communication between your computer and the converter. Now you are good to go.
I hope this article will help you choose the best solution for your usage Scenario.
Interfacing LCD to Arduino uno :
LCD modules form a very important part in many arduino based embedded system designs. So the knowledge on interfacing LCD to arduino is very essential in designing embedded systems. This article is about interfacing a 16×2 LCD to Arduino. JHD162A is the LCD module used here. JHD162A is a 16×2 LCD module based on the HD44780 driver from Hitachi. The JHD162A has 16 pins and can be operated in 4-bit mode or 8-bit mode. Here we are using the LCD module in 4-bit mode. First, I will show you how to display plain text messages on the LCD module using arduino and then few useful projects using LCD and arduino. Before going in to the details of the project, let’s have a look at the JHD162A LCD module.
JHD162A LCD module 16×2 :
The JHD162A has 16 pins and can be operated in 4-bit mode or 8-bit mode. Here we are using the LCD module in 4-bit mode. Before going in to the details of the project, let’s have a look at the JHD162A LCD module.The schematic of a JHD162A LCD module is given below.

The name and functions of each pin of the JHD162A LCD module is given below.
Pin1(Vss):Ground pin of the LCD module.
Pin2(Vcc):+5V supply is given to this pin
Pin3(VEE):Contrast adjustment pin. This is done by connecting the ends of a 10K potentimeter to +5V and ground and then connecting the slider pin to the VEE pin. The voltage at the VEE pin defines the contrast. The normal setting is between 0.4 and 0.9V.
Pin4(RS):Register select pin.The JHD162A has two registers namely command register and data register. Logic HIGH at RS pin selects data register and logic LOW at RS pin will select command register. If we make the RS pin HIGH and put a data on the data lines (DB0 to DB7) it will be recognized as a data. If we make the RS pin LOW and put a data on the data lines, then it will be taken as a command.
Pin5(R/W): Read/Write modes. This pin is used for selecting between read and write modes. Logic HIGH at this pin activates read mode and logic LOW at this pin activates write mode.
Pin6(E): This pin is meant for enabling the LCD module. A HIGH to LOW signal at this pin will enable the module.
Pin7(DB0) to Pin14(DB7): These are data pins. The commands and data are put on these pins.
Pin15(LED+): Anode of the back light LED. When operated on 5V, a 560 ohm resistor should be connected in series to this pin. In arduino based projects the back light LED can be powered from the 3.3V source on the arduino board.
Pin16(LED-): Cathode of the back light LED.
For knowing more about LCD module JHD162A and it interfacing.
Circuit diagram.

RS pin of the LCD module is connected to digital pin 12 of the arduino. R/W pin of the LCD is grounded. Enable pin of the LCD module is connected to digital pin 11 of the arduino. In this project, the LCD module and arduino are interfaced in the 4-bit mode. That means only four of the digital input lines( DB4 to DB7 of the LCD are used). This method is very simple, requires less connections and you can almost utilize the full potential of the LCD module. Digital lines DB4, DB5, DB6 and DB7 are interfaced to digital pins 5, 4, 3 and 2 of the Arduino. The 10K potentiometer is used for adjusting the contrast of the display. 560 ohm resistor R1 limits the current through the back light LED. The arduino can be powered through the external power jack provided on the board. +5V required in some other parts of the circuit can be tapped from the 5V source on the arduino board. The arduino can be also powered from the PC through the USB port. The full program for interfacing LCD to arduino is shown below.
Program.
#include<LiquidCrystal.h>

LiquidCrystal lcd(12, 11, 5, 4, 3, 2);  // sets the interfacing pins

void setup()
{
 lcd.begin(16, 2);  // initializes the 16x2 LCD
}

void loop()
{
  lcd.setCursor(0,0);           //sets the cursor at row 0 column 0
  lcd.print("16x2 LCD MODULE"); // prints 16x2 LCD MODULE
  lcd.setCursor(2,1);           //sets the cursor at row 1 column 2
  lcd.print("HELLO WORLD");     // prints HELLO WORLD
}
About the program.
Library function “LiquidCrystal.h” is used for displaying the desired characters on the LCD module. It is readily available with the Arduino user interface and it can be accessed through the “Import library” in the “sketch” tab in the main menu bar. The LiquidCrystal.h provides functions for almost all applications like printing a string, setting the cursor, initializing the LCD, scrolling the display etc.Program for scrolling the display.
A simple program for scrolling a text on the LCD using arduino is shown here. This is done using the “scroll()” function. For example the function “lcd.scrollDisplayRight()” will scroll the display to right and the function”lcd.scrollDisplayLeft()” will scroll the display to left. A “for” loop is used for selecting the number of positions to scroll at a time. In the program shown below, it is chosen to be 2 because the text to be displayed is comparatively long. For shorter texts more number of positions must be scrolled at a time to get a smooth display.#include <LiquidCrystal.h> int i=0; LiquidCrystal lcd(12, 11, 5, 4, 3, 2); void setup() { lcd.begin(16, 2); //initializes 16x2 LCD lcd.print("16x2 LCD MODULE JHD162A & ARDUINO-UNO"); //text to display } void loop() { for(i=0;i<2;i++) {lcd.scrollDisplayLeft();} //scrolls display left by two positions delay(800); //sets the speed at which display moves }
Digital tachometer using arduino plus speed control :
Tachometer is a device used for measuring the number of revolutions of an object in a given interval of time. Usually it is expressed in revolutions per minute or RPM. Earlier tachometers purely mechanical where the revolution is transferred to the tachometer through mechanical coupling (cable or shaft) , the rpm is determined using a gear mechanism and it is displayed on a dial. With the advent of modern electronics, the tachometers have changed a lot. This article is about a contactless digital tachometer using arduino. The speed of the motor can be also controlled using the same circuit. The RPM and all the other informations are displayed on a 16×2 LCD screen. The circuit diagram of the digital tachometer using arduino is shown below.

Tachometer is a device used for measuring the number of revolutions of an object in a given interval of time. Usually it is expressed in revolutions per minute or RPM. Earlier tachometers purely mechanical where the revolution is transferred to the tachometer through mechanical coupling (cable or shaft) , the rpm is determined using a gear mechanism and it is displayed on a dial. With the advent of modern electronics, the tachometers have changed a lot. This article is about a contactless digital tachometer using arduino. The speed of the motor can be also controlled using the same circuit. The RPM and all the other informations are displayed on a 16×2 LCD screen. The circuit diagram of the digital tachometer using arduino is shown below.
Circuit diagram :
RPM Sensor :
An IR photo transistor and IR LED forms the sensor. IR photo transistor is a type of photo transistor which responds to infra-red waves only. The use of IR phototransistor avoids other light interferences from the environment. The photo transistor and IR diode are aligned side by side. Resistor R2 limits the current through the IR diode. A reflective strip is glued on the rotating object (shaft, disc or fan) in line with the sensor. I used a 9V/100mA cooling fan. The clearence between the sensor and reflective strip has to be less than 1cm. When the reflective strip passes in front of the sensor, IR waves are reflected back to the photo transistor. The photo transistor conducts more at this moment and as a result the voltage across R3(68K resistor) shoots up at this moment. The result will be a waveform like what shown below at the emitter of the photo transistor. RPM can be determined by counting the number of upward shoots in a given interval of time.
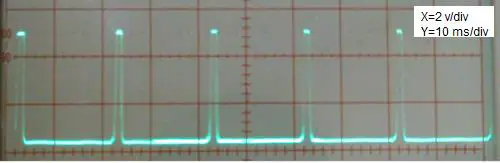
Counting the RPM :
Arduino is used for counting the RPM and displaying it on the LCD screen. Emitter of the photo transistor is connected to the Interrupt 0 (digital pin 2) of the arduino. The arduino interrupt is configured to be rising edge triggered. As a result the will be an interrupt for every upward shoot in the emitter waveform. The number of interrupts occured in a given time is counted by incrementing a variale using the interrupt service routine. The time elapsed during te counting cycle is determined using the millis() function. The millis() function returns the number of milli seconds passed since the arduino board is switched ON. Calling the millis() function before and after the counting cycle and the taking their difference gives the times passed during the counting cycle. The (number of interrupts/time in milliseconds)*60000 will give the revolutions per minute (RPM).
Controlling the speed of motor :
A provision for controlling the motor speed using a potentiometer is also included in the circuit. Transistor Q1 is used for driving the motor. Its base is connected to pwm pin 9 of the arduino through the current limiting resistor R1. Wiper of the speed control POT R4 is connected to anlog pin A0 of the arduino. The voltage at this pin is converted into a value between 0 and 1023 using the anlogRead function. Then this value is divided by four to fit it into the 0 to 255 range. Then this value is written to the PWM pin 9 using the anlogWrite function. The result will be a square wave at pin 9 whose duty cycle is proportional to the value written using the analogWrite function. For example if the value is 255, the duty cycle will be 100% and if the value is 127, the duty cycle will be around 50%. D1 is a free wheeling diode and C1 is a noise by-pass capacitor(de coupler). The rpm and duty cycle are displayed on the LCD screen using the standard LiquidCrystal library. Read this article: Interfacing LCD to Arduino. Full program for the digital tachometer using arduino is shown below.
Program :
#include<LiquidCrystal.h>
LiquidCrystal lcd(12,11,6,5,4,3);
int pwm=9;
int pot=A0;
float value=0;
int percent;
float rev=0;
int rpm;
int oldtime=0;
int time;

void isr() //interrupt service routine
{
rev++;
}

void setup()
{
lcd.begin(16,2);                //initialize LCD
attachInterrupt(0,isr,RISING);  //attaching the interrupt
}

void loop()
{
delay(1000);
detachInterrupt(0);           //detaches the interrupt
time=millis()-oldtime;        //finds the time
rpm=(rev/time)*60000;         //calculates rpm
oldtime=millis();             //saves the current time
rev=0;
value=analogRead(pot);        //reads the speed control POT
value=value/4;
analogWrite(pwm,value);       //sets the desired speed
percent=(value/255)*100;      //finds the duty cycle %
lcd.clear();
lcd.setCursor(0,0);
lcd.print("___TACHOMETER___");
lcd.setCursor(0,1);
lcd.print(rpm);
lcd.print(" RPM");
lcd.print("   ");
lcd.print(percent);
lcd.print("%");
attachInterrupt(0,isr,RISING);

}
Notes :
- The arduino board can be powered using a 9V supply through the external power jack.
- The 5V needed at some parts of the circuit can be tapped from the 5V source on the arduino board.
- The fan I used was rated 9V/100mA. The transistor 2N2222 can handle only upto 800mA. Keep this in mind while selecting the load.
- The LCD module used was JHD162A.
- POT R5 can be used to adjust the contrast of the LCD display. When connected first, the LCD may not show up anything. Adjust the R5 until you get the display. The optimum voltage at the wiper of R5 is between 0.4 to 1V.
- The IR photo transistor and the IR diode both were taken from an LTH-1550 photo interruptor module.
- The lateral surface of the photo transistor must be masked using a tape.
In this article we explain how to do PWM (Pulse Width Modulation) control using arduino. If you are new to electronics, we have a detailed article explaining pulse width modulation. We have explained PWM in this tutorial using 2 examples which will help you learn how to control LED brightness using PWM and how to control DC motor speed using PWM.
PWM control using arduino.
PWM control is a very commonly used method for controlling the power across loads. This method is very easy to implement and has high efficiency. PWM signal is essentially a high frequency square wave ( typically greater than 1KHz). The duty cycle of this square wave is varied in order to vary the power supplied to the load. Duty cycle is usually stated in percentage and it can be expressed using the equation : % Duty cycle = (TON/(TON + TOFF)) *100. Where TON is the time for which the square wave is high and TOFF is the time for which the square wave is low.When duty cycle is increased the power dropped across the load increases and when duty cycle is reduced, power across the load decreases. The block diagram of a typical PWM power controller scheme is shown below.

Control signal is what we give to the PWM controller as the input. It might be an analog or digital signal according to the design of the PWM controller. The control signal contains information on how much power has to be applied to the load. The PWM controller accepts the control signal and adjusts the duty cycle of the PWM signal according to the requirements. PWM waves with various duty cycle are shown in the figure below.

In the above wave forms you can see that the frequency is same but ON time and OFF time are different.Two applications of PWM control using arduino is shown here. Controlling the LED brightness using arduino and motor speed control using arduino.
LED brightness control using arduino :
This one could be the simplest example of PWM control using arduino. Here the brightness of an LED can be controlled using a potentiometer. The circuit diagram is shown below.

In the circuit, the slider of the 50K potentiometer is connected to analog input pin A0 of the arduino. The LED is connected at digital pin 12 of the arduino. R1 is a current limiting resistor. The working of the program is very simple. Arduino reads the voltage at the analog input pin A0 (slider of the POT). Necessary calculations are done using this reading and the duty cycle is adjusted according to it. The step-by-step working is noted in the program below.
Program :
int pwm = 12; // assigns pin 12 to variable pwm
int pot = A0; // assigns analog input A0 to variable pot
int t1 = 0;   // declares variable t1
int t2 = 0;   // declares variable t2
void setup()  // setup loop
{
  pinMode(pwm, OUTPUT); // declares pin 12 as output
  pinMode(pot, INPUT);  // declares pin A0 as input
}
void loop()
{
  t2= analogRead(pot); // reads the voltage at A0 and saves in t2
  t1= 1000-t2;         // subtracts t2 from 1000 ans saves the result in t1
  digitalWrite(pwm, HIGH); // sets pin 12 HIGH
  delayMicroseconds(t1);   // waits for t1 uS (high time)
  digitalWrite(pwm, LOW);  // sets pin 12 LOW
  delayMicroseconds(t2);   // waits for t2 uS (low time)
}
Example :
The following example helps you to understand the stuff better.Suppose the slider of the potentiometer is adjusted so that the voltage at its slider is 3V. Since the slider terminal is connected to A0 pin, the voltage at A0 pin will be also 3V. analogRead function in arduino reads the voltage (between 0 to 5V) at the analog input pin,converts it in to a digital value between 0 and 1023 and stores it in a variable.Since the analog input voltage here is 3 volts the digital reading will be 3/(5/1023) which is equal to 613. This 613 will be saved to variable t2 (low time). Then t2 is subtracted from 1000 and the result which is 387 is stored in variable t1 (high time). Then digital pin will be switched on for t1 uS and switched off for t2 uS and the cycle is repeated. The result will be a square wave with high time = 387 uS and low time = 613 uS and the time period will be always 1000uS. The duty cycle of this wave form will be (387/(387+613))*100 which is equal to 38.7%. The wave form will look something like what is shown below.Motor speed control using arduino :
Circuit diagram of DC motor speed control using arduino is shown in the figure below. The working principle and program of this circuit is same as that of the LED brightness control. Only difference is that and additional motor driver circuit using a transistor is included in the circuit. Each digital pin of the arduino can sink or source only 40mA. DC motors usually consume much more than this and it is not safe to directly connect a heavy load to the digital pin.In the circuit diagram, slider of the potentiometer is connected to analog input pin A0 of arduino. Resistor R1 limits the base current of the transistor Q1. Motor is connected as collector load to the transistor. Capacitor C1 by-passes voltage spikes and noises produced by the motor. This filter capacitor is very essential and if it is not there the circuit may not work properly.Program :
int pwm = 12; // assigns pin 12 to variable pwm int pot = A0; // assigns analog input A0 to variable pot int t1 = 0; // declares variable t1 int t2 = 0; // declares variable t2 void setup() // setup loop { pinMode(pwm, OUTPUT); // declares pin 12 as output pinMode(pot, INPUT); // declares pin A0 as input } void loop() { t2= analogRead(pot); // reads the voltage at A0 and saves in t2 t1= 1000-t2; // subtracts t2 from 1000 ans saves the result in t1 digitalWrite(pwm, HIGH); // sets pin 12 HIGH delayMicroseconds(t1); // waits for t1 uS (high time) digitalWrite(pwm, LOW); // sets pin 12 LOW delayMicroseconds(t2); // waits for t2 uS (low time) }Notes :

.jpg)
- In both circuits shown above the arduino is supposed to be powered through the 9V external power input jack.
- +5V supply for the potentiometer can be taken from the 5V regulator output on the arduino board.
- The DC motor I used while testing was rated 9V/100mA.
- The LED I used while testing was a general purpose 4mm bright green LED.
- The maximum collector current 2N2222 can handle is 800mA. Keep this in mind while selecting the motor.
- Be very careful while handling the arduino board. Any wrong connections might damage the board
As we know frequency = Number of full circle per second. So for making frequency meter we have to count number of positive pulses for external signal which we have to measure. As I mention earlier we have to configure T1CON (Timer1 Control Register) properly as per our requirement. For reading external clock (or pulse) we normally set the prescaler 1:1 ratio. It means we do not delay the sampling of the external pulse, but treat the external clock as it is to count number of pulses for specified time duration.

So if we run Timer 1 as a counter mode, there are two pins we can use to apply the external clock pulse RC0/T1OSO and RC1/T1OSI. Selection of one of them is controlled by the T1OSCEN bit.
Setting the bit selects RC1/T1OSO and clearing it does for RC0/T1OSI. In our project as we use counter mode is synchronous, we clear the T1SYNC bit. For TMR1CS bit, we set it for external clock counting. Finally, we set the TMR1ON bit to start the Timer1 module. Counting of the rising edge of the external clock pulse would increase the TMR1 registers by one for every external clock. And TMR1 register made with two 8 bit register TMR1L and TMR1H.When the content of TMR1 crosses from FFFFh to 0000h, the Timer1 interrupt bit TMR1IF would be set, if interrupt is enabled. Usually, when we count number of pulses within a period, we disable the interrupt, and after the lapse of the time, we stop the timer and read the content of TMR1 register.
To make our project “Digital frequency meter by PIC microcontroller using timer 1” Then what will be our bit pattern of TICON register? For counting external clock pulses entered to the pin 15 RC0/T1OSO, bit pattern of T1CON register would be 00000010. When we start the counting, we set the TMR1ON, bit0 of the T1CON and that time bit pattern of T1CON register will be 00000011.
In bellow you see the circuit diagram for simulation in Proteus for our project “Digital frequency meter by PIC microcontroller using timer 1 “.

this is a video to explain you more about this project:
In bellow you will find the complete c code written in mikro c pro for pic.
// LCD module connections
sbit LCD_RS at RB4_bit;
sbit LCD_EN at RB5_bit;
sbit LCD_D7 at RB0_bit;
sbit LCD_D6 at RB1_bit;
sbit LCD_D5 at RB2_bit;
sbit LCD_D4 at RB3_bit;sbit LCD_RS_Direction at TRISB4_bit;
sbit LCD_EN_Direction at TRISB5_bit;
sbit LCD_D7_Direction at TRISB0_bit;
sbit LCD_D6_Direction at TRISB1_bit;
sbit LCD_D5_Direction at TRISB2_bit;
sbit LCD_D4_Direction at TRISB3_bit;
// End LCD module connections
void main() {
int c=0,i=0,z=0;
char txt[5],txt1[5],*res;;
lcd_init();
lcd_cmd(_LCD_CLEAR);
lcd_cmd(_LCD_CURSOR_OFF);
TRISC=1;
TRISB=0;
TRISD=0;
PORTD= 0;
TMR1L=0;
TMR1H=0;
lcd_out(1,1," WORKING..");
delay_ms(100);
lcd_out(1,1," WORKING….");
delay_ms(100);
lcd_out(1,1," WORKING……");
T1CON= 0B00000011;delay_ms(1000);
T1CON= 0B00000010;
c= TMR1L;
i= TMR1H * 256;
z= c+i;
IntToStr(z,txt);
lcd_cmd(_LCD_CLEAR);
delay_ms(100);
lcd_out(1,1," FREQUENCY IS");
delay_ms(100);lcd_out(2,0,txt);
lcd_out(2,7," Hz");
}
What is a Smart Antenna?
Smart Antennas, also known as multiple antennas, adaptive array antennas, and so on is used to increase the efficiency in digital wireless communication systems. It works by taking the advantage of the diversity effect at the transceiver of the wireless system that is the source and the destination. The term diversity effect refers to the transmission and reception of multiple radio frequencies that are used to decrease the error during data communication and also to increase data speed between the source and the destination.
This type of technology has already found its significance in most of the wireless communication systems as special antenna arrays are used with signal processing algorithms which can easily locate and track the different wireless targets such as mobiles. It is also used to calculate the beam forming vectors and the direction of arrival [DOA] of the signal.
Difference between Conventional Antenna and Smart Antenna
The main difference is related with the way both the systems deal with the problems caused by multipath wave propagation. When a wireless signal is sent to a large distance it may have to pass many barriers like tall buildings, mountains, utility wires and so on. Thus these signals’ wave fronts will be scattered and will take multiple paths to reach the receiver. In a conventional wi-fi communication system, a method called single input single output [SISO] is used, that is one antenna will be connected to the source and another one will be connected to the destination. When the signals arrive late at the destination, they may arrive faded, cut-out and also with common communication problems like picket fencing. This is one of the basic problems of a SISO system. Thus if we use SISO system in a internet connection, the data will arrive late and that too erroneous in nature. All these problems can be solved with the help of Smart Antennas.
Smart Antenna – Functions
A smart antenna has mainly two basic functions. They are explained in detail below.
1. Estimation of Direction of arrival (DOA)
In smart antennas various techniques like MUSIC (Multiple Signal Classification) and estimation of signal parameters via rotational invariance techniques (ESPRIT) algorithms are used to find the DOA of a signal. This method requires a lot of computations and algorithms. Even Matrix Pencil method is commonly used in smart arrays to find the DOA. Matrix Pencil method is more commonly used in real time systems as they are highly efficient than the other two. The antenna acts like a sensor in which a spatial spectrum of the array is selected and the DOA is found out from the peaks of this spectrum.
2. Beamforming Method
The mobiles or targets at which the signals are to be sent are first sought out and then a radiation pattern of the antenna array is created by adding the signal phases. At the same time the mobiles which will not need the signal will be out of pattern. Though this method may seem a little to complicated, it can be done easily with the help of a FIR tapped delay line filter. According to the signal used the weight of the FIR filter can also be changed accordingly. The filters will also be helpful in providing optical beamforming so as to decrease the MMSE between the actual and wanted beam pattern that is formed.
Types of Smart Antennas
The classification of Smart Antennas depends on the type of environment and the requirements of the system. There are mainly two types of Smart Antennas. They are
1. Phased Array/Beam Smart/Multi-beam Antenna
In this type of array, there will be numerous amount of fixed beams amongst which one beam will turn on or will be steered towards the wanted signal. This can be done only with the help of adjustment in the phase. In other words, as the wanted target moves, the beam will also be steered. The figure of a phased array antenna is shown below.

2. Adaptive Array Antenna
In this type of antenna, there will be a change in the beam pattern according to the movement of the wanted user and the movement of the interference. The signals that are received will be weighted and later combined to increase the wanted signal to interference in addition to the noise and power ratio [S/N]. Thus, the direction of interference will be balanced as the wanted signal will be in the direction of the main beam.
The antenna can easily steer the main beam to any direction, while at the same time nullifying the interfering signal. The direction of the beam can be calculated using the DOA method. The figure of an adaptive array antenna is shown below. Take a look.

Another way of categorizing smart antennas is in the number of inputs and outputs that is used for the device. According t this classification the categories are given below.
1. SIMO (Single Input – Multiple Output)
In this method one antenna will be used at the source and multiple antennas will be used at the destination.
2. MISO (Multiple Input – Single Output)
In this method, multiple antennas will be used at the source and only one antenna will be used at the receiver.
3. MIMO (Multiple Input – Multiple Output)
In this method multiple antennas will be used at both the source and the destination. This is the most efficient method amongst all. This method was extended recently in accordance to the IEEE 802.11n standard. This method clearly supports spatial information processing.
Advantages
- Both beam smart and adaptive arrays provide high efficiency and thus high power for the desired signal. When a large number of antenna elements are used at a higher frequency, Beam Smart antennas use narrow pencil beams. Thus high efficiency is obtained in the direction of the desired signal. If a fixed number of antenna elements are used the same amount times the power gain will be produced with the help of adaptive array antennas.
- Another advantage is in the amount of interference that is suppressed. Beam smart antennas suppress it with the narrow beam and adaptive array antennas suppress the interference by adjusting the beam pattern.
Disadvantages
The main disadvantages are
- Cost
The cost of such a device will be more, not only in the electronics section, but also in the power. That is the device is way too expensive [especially if MIMO methods are used.], and will also decrease the life of battery of mobiles. The receiver chains that are used must be reduced in order to reduce the cost. Also the costs rise up due to the RF electronics and A/D converter used for each antenna.
- Size
For this method to be efficient large base stations are needed. This will increase the size. Apart from this multiple external antennas are needed on each terminal. This is not practical. But companies re trying methods like dual polarization to reduce the size.
- Diversity
When multiple mitigation is needed, diversity becomes a big problem. The terminals and base stations must have multiple antennas. There are mainly three types of diversities. They are spatial, polarization, and angle.
Spatial separation of the antennas that are used is practically impossible when it is applied on mobile phones. It is also difficult to be achieved in point-to-point systems where a near line-of-sight exists between the transmitter and receiver. By using polarized diversity, the above problem can be avoided to a certain point. Dual polarization can be easily instigated without the use of spatial separation.
Angular diversity is the most commonly used method nowadays. The signals which have the maximum signal power are selected from multiple beams and are used to maintain diversity. But the gain depends on the angular spread. That is, if the spread is small, the diversity will also be small.
- Tracking
- Spatial-temporal processing
- Hooks in international
- standards to include provisions for smart antennas
- Vertical integration
Simple temperature logger using arduino (°C & °F).
This project is about a simple USB temperature logging system using arduino uno and the serial monitor function in the arduino IDE. The system monitors the temperature every 2 seconds and shows it on the arduino serial monitor. The temperature is shown in °Celsius and °Fahrenheit. The system is interfaced to the PC through the USB port. LM35 is used as the temperature sensor.
LM35 is three terminal linear temperature sensor from National semiconductors. It can measure temperature from-55c to +150C. The voltage output of the LM35 increases 10mV per degree Celsius rise in temperature. LM35 can be operated from a 5V supply and the stand by current is less than 60uA. The pin out of LM35 is shown in the figure below.

Circuit diagram :

Temperature sensor LM35 is interfaced to the Arduino through the analog input pins A0, A1 and A2. Analog input pin A0 is made high and it acts as the 5V supply pin for the LM35. Analog input pin A2 is made low and it acts as the ground pin for the LM35. Analog input pin A1 is set as an input and the voltage output of LM35 is coupled to the arduino through this pin. This scheme is very useful because you can plug the LM35 directly into the analog input female connector and no external connection wires are needed. The arduino board is powered by the PC through the USB cable and no external power supply is needed in this circuit. The USB port also serves as the medium for communication between arduino and PC.
Program :
int t=0;
int vcc=A0; // sets analog input A0 as +5V source for LM35
int sensor=A1; // sets A1 as the sensor input
int gnd=A2; // sets analog input A2 as ground for LM35
float temp;
float tempc;
float tempf;
void setup()
{
  pinMode(vcc,OUTPUT);
  pinMode(gnd,OUTPUT);
  pinMode(sensor,INPUT);
  digitalWrite(vcc,HIGH); // sets analog input A0 HIGH
  digitalWrite(gnd,LOW);  // sets analog input A2 LOW
  Serial.begin(9600);     // sets the baud rate at 9600

}
void loop()
{ delay(2000); // calls a 2 second delay
  t=t+2;       // increments the time by 2 every two seconds
  temp=analogRead(sensor); // reads the LM35 output
  tempc=(temp*5)/10;       // converts the digital value into temperature degree C
  tempf=(tempc*1.8)+32;    // converts degree C to degree F
  Serial.println("...............");
  Serial.println("Temperature logger");
  Serial.print("Time in sec = ");  // prints the time on serial monitor window
  Serial.println(t);
  Serial.print("Temperature in deg C = "); // prints the temperature in degreeC
  Serial.println(tempc);
  Serial.print("Temperature in deg F = "); // prints the temperature in degreeF
  Serial.println(tempf);
}
About the program :

The voltage output of LM35 is connected to the  analog input A1 of the arduino. The voltage at this pin will be proportional to the temperature and this voltage is read using analogRead function. The analogRead function will read the voltage (in a range 0 to 5) at a particular analog input pin and converts it into a digital value between 0 and 1023. For example, if 29°C is the temperature, the output of LM35 will be 290mV.  The result of the analogRead function will be 290mV/(5/1023) =59. There must be some way to convert this 59 to 29.0 for displaying in the serial monitor window. This is done by multiplying 59 by 5 and then dividing the result by 10. The result will be the temperature in °C and it is displayed using Serial.print function. Then it is converted to °F using the following formula: °F= (°C*1.8)+32. The temperature in °F is also displayed. The serial monitor can be accessed from the Tools tab in the arduino IDE. The shortcut for serial monitor is ctrl+shift+M. The snapshot of the serial monitor window is shown in the figure below.

0-5V voltmeter using arduino.
This article is about a simple 3 digit voltmeter using arduino. The circuit can measure anything between 0 to 5V at an accuracy of 50mV. The circuit uses minimum number of external components and can be easily modified for different voltage ranges. The display device is a common anode multiplexed seven segment LED display module (Type No:E1-3056ASR1). Let’s have a look at the display device first.
E1-3056ASR1.
It is a low cost multiplexed 3 digit seven segment LED module of common anode type. Using such a multiplexed module instead of three separate display modules save a lot of wiring and effort. Such multiplexed modules of different configurations are now commonly available in the market. The figure below shows pin out of the E1-3056ASR1 display module used here.

Circuit diagram.

Common anode terminals of each display are interfaced to the digital output pins 1, 2, 3 of the arduino respectively. Segments a to dotpoint of the display are interfaced to the digital output pins (5 to 12) of the arduino. The voltage to be measured is applied to the analog input pin A0 of the arduino. Arduino-Uno has six analog input channels named A0, A1, A2, A3, A4 and A5. The voltage in the range of 0 to 5V applied to each of the pin can be converted into a digital value in the range 0 to 1023 using “analogRead” function. That means the sensitivity of each internal ADC channel is 5/1023 which is equal to 4.88mV. The program for digital voltmeter using arduino is shown below.
Program.
int a;
int vin;
int input=A0;
int disp1=1;
int disp2=2;
int disp3=3;
int segA=5;
int segB=6;
int segC=7;
int segD=8;
int segE=9;
int segF=10;
int segG=11;
int segDP=12;
void setup()
{
pinMode(disp1, OUTPUT);
pinMode(disp2, OUTPUT);
pinMode(disp3, OUTPUT);
pinMode(segA, OUTPUT);
pinMode(segB, OUTPUT);
pinMode(segC, OUTPUT);
pinMode(segD, OUTPUT);
pinMode(segE, OUTPUT);
pinMode(segF, OUTPUT);
pinMode(segG, OUTPUT);
pinMode(segDP, OUTPUT);
pinMode(input,INPUT);
}
void loop()
{
vin=analogRead(input);
vin=vin/2.046;
a = vin%10;
if(a<=5)
{a=0;}
else
{a=5;}
digitalWrite(disp1,LOW);
digitalWrite(disp2,LOW);
digitalWrite(disp3, HIGH);
digitalWrite(segDP,HIGH);
display(a);
delay(5);
vin = vin/10;
a = vin%10;
digitalWrite(disp3,LOW);
digitalWrite(disp2,HIGH);
digitalWrite(segDP,HIGH);
display(a);
delay(5);
vin=vin/10;
a=vin;
digitalWrite(disp2,LOW);
digitalWrite(disp1,HIGH);
digitalWrite(segDP,LOW);
display(a);
delay(5);

}
int display (int a)
{
switch (a)
{
case 0:
digitalWrite(segA, LOW);
digitalWrite(segB, LOW);
digitalWrite(segC, LOW);
digitalWrite(segD, LOW);
digitalWrite(segE, LOW);
digitalWrite(segF, LOW);
digitalWrite(segG, HIGH);
break;

case 1:
digitalWrite(segA, HIGH);
digitalWrite(segB, LOW);
digitalWrite(segC, LOW);
digitalWrite(segD, HIGH);
digitalWrite(segE, HIGH);
digitalWrite(segF, HIGH);
digitalWrite(segG, HIGH);
break;

case 2:
digitalWrite(segA, LOW);
digitalWrite(segB, LOW);
digitalWrite(segC, HIGH);
digitalWrite(segD, LOW);
digitalWrite(segE, LOW);
digitalWrite(segF, HIGH);
digitalWrite(segG, LOW);
break;

case 3:
digitalWrite(segA, LOW);
digitalWrite(segB, LOW);
digitalWrite(segC, LOW);
digitalWrite(segD, LOW);
digitalWrite(segE, HIGH);
digitalWrite(segF, HIGH);
digitalWrite(segG, LOW);
break;

case 4:
digitalWrite(segA, HIGH);
digitalWrite(segB, LOW);
digitalWrite(segC, LOW);
digitalWrite(segD, HIGH);
digitalWrite(segE, HIGH);
digitalWrite(segF, LOW);
digitalWrite(segG, LOW);
break;

case 5:
digitalWrite(segA, LOW);
digitalWrite(segB, HIGH);
digitalWrite(segC, LOW);
digitalWrite(segD, LOW);
digitalWrite(segE, HIGH);
digitalWrite(segF, LOW);
digitalWrite(segG, LOW);
break;

case 6:
digitalWrite(segA, LOW);
digitalWrite(segB, HIGH);
digitalWrite(segC, LOW);
digitalWrite(segD, LOW);
digitalWrite(segE, LOW);
digitalWrite(segF, LOW);
digitalWrite(segG, LOW);
break;

case 7:
digitalWrite(segA, LOW);
digitalWrite(segB, LOW);
digitalWrite(segC, LOW);
digitalWrite(segD, HIGH);
digitalWrite(segE, HIGH);
digitalWrite(segF, HIGH);
digitalWrite(segG, HIGH);
break;

case 8:
digitalWrite(segA, LOW);
digitalWrite(segB, LOW);
digitalWrite(segC, LOW);
digitalWrite(segD, LOW);
digitalWrite(segE, LOW);
digitalWrite(segF, LOW);
digitalWrite(segG, LOW);
break;

case 9:
digitalWrite(segA, LOW);
digitalWrite(segB, LOW);
digitalWrite(segC, LOW);
digitalWrite(segD, LOW);
digitalWrite(segE, HIGH);
digitalWrite(segF, LOW);
digitalWrite(segG, LOW);
break;
}}
About the program.
The analog voltage applied to analog input pin A0 is read using analogRead function. The digital equivalent on the analog input voltage is stored in variable vin. For example if 2.5V is the analog input, then the data loaded into variable “vin” after analogRead will be 2.5V/4.8mV= 511. The digital value in variable “vin” is divided by2.056 in order to make a 0 t0 500 swing in the digital reading corresponding to the 0 to 5V swing in the input voltage. The variable “vin” is over written by the result of the division. The next job of the program is to display the number in the variable “vin”.For that each digit in the variable “vin” is isolated and displayed on the appropriate segments. For example, if 256 is the number in “vin”, then 2 is displayed on display 1, 5 is displayed on display 2 and 6 is displayed on display 3. A small delay of around 5 mS is given in between switching of the segments. This is done continuously and the observer feels like 256 due to persistence of vision. Decimal point of the first display is also kept activated while switching the first segment. The individual digits are isolated and displayed by the following method.Suppose 256 is the number to be displayed. Firstly modulus of 256 is determined using “%” operator and the result will be 6. Then it is stored in variable “a”. The the variable “a” is checked using the if statement. If “a” is less than five then “a” is overwritten by 0 and if “a” is greater than 5 it is over written by 5. This reduces the sensitivity of the voltmeter but makes the third digit stable. Then the third display is switched ON and other displays are held OFF. Then the function “display” for displaying 6 is called. The result will be 6 displayed on the third display. Then a delay of 5 ms is called.After this delay, 256 is divided by 10 and variable “vin” is overwritten by the quotient which is 25. Then the modulus of 25 is determined. The modulus of 25 is 5 and it is stored in variable a. The second display is activated and the other displays are deactivated. Then the function display is called again. The result will be 5 displayed on the second display. A delay of 5 mS is called again.Then the number 25 in variable “vin” is divided by ten again. The quotient of the operation will be 2. This 2 is overwritten to variable “vin”. Then the variable “vin” is copied to variable a .The first display is activated and the other displays are deactivated. The decimal point of the first display is also activated. Then the display function is called again. The result will be the digit 2 displayed on the third display. A delay of 5 mS is called again and the entire cycle is repeated.The function display is implemented using conditional branching based on “switch” and “break” statements. Whenever the “display” function is called it will output the segment drive pattern for the current digit in variable “a” on the digital output pins (5 to 12). This is done by checking the current digit in variable “a” and jumping to the appropriate case. Suppose 6 is the digit in variable “a”. Then the statement “switch(a)” will make the program to jump to “case:6″ which will result in writing the segment drive pattern of 6 on the digital output pins ( 5 to 12) appropriately.LCD version of the arduino voltmeter.
This is just an LCD version of the voltmeter shown above. JHD162A is the LCD display used here. It is a 16×2 LCD display with back light. The circuit diagram of the LCD voltmeter using arduino is shown in the figure below.Circuit diagram.
Program.
#include<LiquidCrystal.h> int vin=A0; float value; LiquidCrystal lcd(12,11,5,4,3,2); //library initialization void setup() { pinMode(vin,INPUT); lcd.begin(16,2); lcd.setCursor(1,0); lcd.print("LCD VOLTMETER"); } void loop() { value=analogRead(vin); value=value/200; value=value*0.978; lcd.setCursor(3,1); lcd.print(value); lcd.print(" volts"); delay(300); }


